Diagnose VPS2 localization with VPS Debugger
VPS2 tracking states tell you the outcome of localization, such as whether a device has a coarse or precise position and whether an anchor is tracked. They do not show the sequence of requests, responses, and sensor inputs that produced that outcome.
VPS Debugger records those detailed VPS2 session events. When enabled, NSDK writes an NDJSON log file (VpsDebuggerLog_*) that you can inspect offline in the VPS Debugger Viewer. The viewer can help you determine whether localization requests occurred, how the service responded, how long requests took, what the camera observed, and how geographic estimates changed during the session.
Capture a VPS Debugger session when:
- Device or anchor tracking state does not progress as expected.
- An anchor remains
notTrackedorlimited. - Localization is slow, intermittent, or does not succeed.
- VPS2 geolocation does not agree with other location sources.
- You need to compare a working session with a failing session.
VPS Debugger focuses on the VPS2 localization pipeline. It can provide evidence about configuration, localization requests, network behavior, input frames and poses, and map localization quality. It does not by itself validate application rendering or the transforms your app uses to place content after localization.
Configure VPS Debugger
VPS Debugger is the event producer. VPS Debugger Viewer is the web application that displays those events. The same viewer can either open a saved event log or receive events live from an embedded WebView.
The following configuration enables VPS Debugger. Apply it before the VPS2 session starts.
On ARVps2Manager, enable VPS Debugger Enabled, or configure it as follows:
vps2Manager.VpsDebuggerEnabled = true;
// Set to true to include frame thumbnails (~3–5 KB per request).
vps2Manager.VpsDebuggerSavingFrameImageEnabled = false;
To include frame thumbnails, set vps2Manager.VpsDebuggerSavingFrameImageEnabled to true.
Frame thumbnails are 180×135 JPEG copies of camera frames submitted with VPS map-localization requests, and each thumbnail adds approximately 3–5 KB to the debugger data. The vpsDebuggerSavingFrameImageEnabled and enableVpsDebuggerSavingFrameImage settings control whether those thumbnails are saved. They appear in the selected request's details so you can check what the camera saw and compare the image with the reported gravity direction. Without thumbnails, the viewer can report gravity direction but cannot show the corresponding camera image. Enable frame thumbnails when you need to inspect request images or gravity direction, such as ground-only views or custom camera setups.
Use Saved Log Analysis to inspect VPS Debugger events.
Saved Log Analysis
Use the following workflow to record the complete session on the device and inspect it afterward in a desktop browser:
-
Reproduce the issue.
After starting VPS2 with the debugger enabled, reproduce the behavior on a device.
- Capture enough of the session to include the unexpected tracking-state transition or localization result.
- If the behavior is intermittent, capture a working session as well so you can compare the two logs.
-
Copy the log from the device.
Log files are named
VpsDebuggerLog_*and are written to the same diagnostic output directory aslog.txt.Logs are written under Unity’s
Application.persistentDataPathon the device in the same directory used for other NSDK diagnostic output. Use your platform’s device file tools including adb, Xcode Devices and Simulators, to locate files whose names start withVpsDebuggerLog_.The Session Info panel in the viewer shows the
filePathrecorded when the session started. -
Open the saved log.
- Open the VPS Debugger Viewer in a desktop browser.
- Drop one or more
VpsDebuggerLog_*files onto the page (or use the file / folder picker).
Continue with Viewer panel reference.
Viewer panel reference
Use Viewer panel reference to decide which VPS Debugger Viewer panel best matches the behavior you are investigating and what each panel can confirm.
The following image shows the main VPS Debugger Viewer panels described in this section, including Session Info, Geo Map, request timelines, and localization statistics:
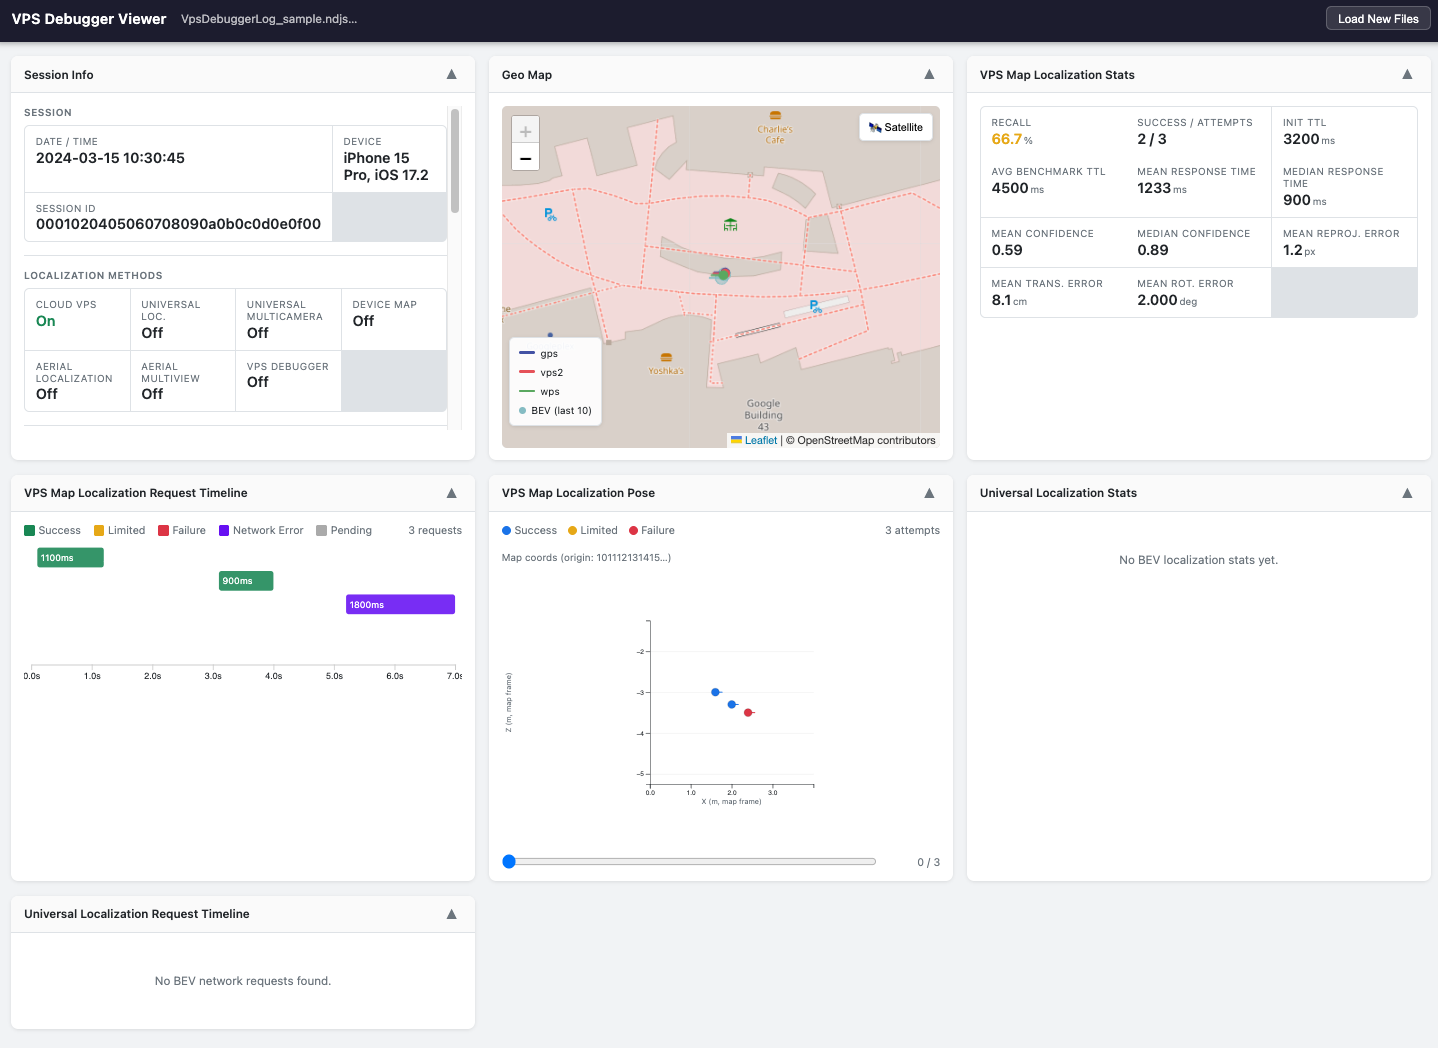
Use the following table to understand what each panel shows and when to use it during diagnosis:
| Panel | What it shows | Use it to |
|---|---|---|
| Session Info | Device, timestamp, session identifier, and VPS2 configuration | Confirm that you opened the expected session and that the intended localization methods and request rates were enabled. |
| Geo Map | Geographic trajectories from GPS, WPS, VPS2, and other sources | Compare location sources and inspect when their paths converge or diverge. WPS is Wi‑Fi Positioning System output. VPS map diamonds mark recorded map-topology points and appear only when optional map-topology events are present. |
| VPS Map Localization Stats | Aggregated cloud VPS map localization statistics | Review attempts, recall, response times, confidence, and time to localize across the session. VPS map localization means localization against a specific mapped Site. |
| VPS Map Localization Request Timeline | VPS map localization requests and their status, duration, exact network error, gravity direction, and optional frame thumbnail | Determine whether requests occurred, select a request for details, and distinguish localization failure from network or authorization errors. |
| VPS Map Localization Pose | Camera positions and headings for VPS map localization attempts | Compare attempts spatially. Before the first successful localization, positions use tracking coordinates; afterward, the viewer can show map coordinates. |
| Universal Localization Stats | Aggregated universal localization statistics | Review the success rate and timing of cloud geopositioning. |
| Universal Localization Request Timeline | Universal localization requests and their status and duration | Determine whether cloud geopositioning requests occurred and how they completed. |
When you load more than one saved log, use Multi-Session Summary to compare date range, aggregate metrics, and individual sessions. Click a row to set the active session for the other panels. Multi-session comparison does not apply to a single live session.
Start with the request timeline:
- Open Session Info and confirm that this is the expected session and configuration.
- Open VPS Map Localization Request Timeline and determine whether map-localization requests occurred.
- Select a relevant request to inspect its status, duration, exact error, gravity direction, and optional frame thumbnail.
- Use the statistics, pose, geo, or universal localization panels based on the behavior you observed in the app.
The behavior is observed in your app; the viewer provides evidence that helps distinguish possible causes. It does not automatically identify the cause. Guidance that mentions request images requires frame thumbnails to have been enabled when the session was captured.
Diagnose observed behavior
Start from the behavior you observe in the app or NSDK API. Then use the viewer and raw log evidence in the linked section to narrow the cause. Start with missing data or missing requests before investigating request failures, latency, or incorrect results, because later checks depend on those events being available.
| Observed in app or NSDK API | Use this section when | See |
|---|---|---|
| VPS map localization does not succeed | You need to determine whether the session has no debugger data, no VPS requests, or failed VPS requests. | Not localizing |
| Localization is delayed or inconsistent | Localization eventually succeeds, but only after long delays or inconsistent attempts. | Slow or intermittent localization |
| Geographic position looks wrong | VPS2, WPS, or GPS position in the app does not match the expected location. | Wrong geographic position |
| Anchor or content pose looks wrong | An anchor remains limited, or placed content has the wrong position or orientation after localization. | Wrong anchor or content pose |
Not localizing
Use this section when VPS map localization never produces a usable result. Choose the tab that best matches what the viewer shows: no debugger data, no VPS requests, explicit VPS request errors, or a LocalizationFailed request.
- No debugger data
- No VPS requests
- Request errors
- LocalizationFailed
No saved VpsDebuggerLog_* file is available to open in the viewer, and no live debugger events appear in the embedded viewer. In that case, the viewer has no debugger data to diagnose. Use the following table to check the most basic app-side setup and startup problems first.
| Possible cause | How to check | Next action |
|---|---|---|
| Access token is not set | Check the app configuration and authentication logs. | Set the access token before starting the NSDK session. |
| VPS Debugger was not enabled before VPS2 started | Check the configuration in your app. | Enable VPS Debugger, restart VPS2, and reproduce the issue. |
| VPS2 session never started | Check the session lifecycle and log.txt. | Configure and start VPS2, then capture another session. |
The viewer opens the session, but VPS Map Localization Request Timeline is empty. That means the viewer has debugger data, but it did not record any VPS map localization requests. Use the following table to narrow down why requests never appeared.
| Viewer evidence | Possible cause | Next action |
|---|---|---|
| Cloud VPS is off in Session Info | VPS map localization was disabled in the session configuration. | Enable VPS map localization, restart VPS2, and reproduce the issue. |
| Cloud VPS is on, but the timeline is empty | A target Site anchor may not have been tracked, or the input session may not be producing usable frames. The viewer does not currently display anchor events. | Verify in the app that you called the anchor tracking API and inspect the anchor tracking state. See Place virtual content with VPS2. Check log.txt for frame or session errors. |
Universal Localization Request Timeline is empty or shows FrameRejected with NoValidPrior | Universal localization did not have a valid geographic prior such as GPS, or the session did not produce usable requests for coarse geopositioning. Universal localization estimates the device's geographic position from camera imagery and a geographic prior such as GPS, before or alongside VPS map localization. | Confirm location permission and a current GPS fix. For a custom input pipeline, include valid geographic data in the frame. Check log.txt for frame, location, or session errors. |
VPS Map Localization Request Timeline shows requests, and one or more of those requests ends with an explicit error or FrameRejected status. Use the following table to match that failure signal to the most likely cause and next action.
| Viewer or log evidence | What it indicates | Next action |
|---|---|---|
The request error is BadApiKey | The access token is invalid or expired. | Replace the token and confirm that authentication succeeds. |
The request error is PermissionDeniedError | The token cannot access the requested Site or operation. | Confirm organization and Site access for the token. |
The request error is BadNetworkConnection | The request could not complete because of network connectivity. | Test with a reliable connection and compare request durations with a working session. |
The request error is NoMapFound | The service did not find map data for the request. | Confirm that the correct Site anchor is tracked and that the Site has a processed VPS map. |
The request error is RequestsLimitExceeded or QuotaExceeded | The request or account limit was exceeded. | Reduce the request rate or check the account quota. |
The request error is InternalServer, InternalClient, or another displayed error | The request failed for a reason not covered above. | Retry under controlled conditions, compare with a working session, and share the diagnostic files if the error persists. If the viewer does not display a specific error, inspect the raw VpsDebuggerLog_* event for UnknownError. |
The request is FrameRejected with BadTracking, BadCameraAngle, or DeviceUpsideDown | FrameRejected means NSDK rejected an input frame instead of sending a usable localization request. | Confirm normal device tracking and orientation. If frame thumbnails are enabled, compare the image and gravity direction from a working session. |
| Universal Localization Request Timeline shows failed requests with a network, authorization, quota, client, or server error while the session never localizes | Coarse geopositioning could not complete normally, and that may contribute to the session never reaching a usable result. | Apply the corresponding action from the failed request, then compare both timelines with a working session. |
VPS Map Localization Request Timeline shows the request error LocalizationFailed. That means the request completed normally, but the frame still did not localize. Use the following table to inspect the most common viewer evidence for why localization still failed.
Rows that refer to request thumbnails require frame thumbnails to have been enabled when the session was captured. See Configure VPS Debugger.
| Viewer evidence | What it may indicate | Next action |
|---|---|---|
| Failed request thumbnails show mostly ground, sky, or low-texture surfaces | The submitted images lack distinctive visual features. | Point the camera toward distinctive features and reproduce the issue. |
| The request thumbnail orientation does not match the gravity arrow | The image and pose may not describe the same frame. | Confirm that the image, intrinsics, timestamp, and pose all come from the same frame. Comparing the image and gravity direction requires a frame thumbnail. |
| The mismatch appears in a custom camera pipeline | The pose or image contract passed into NSDK may be incorrect. | Verify that the image, intrinsics, timestamp, and camera extrinsics all belong to the same frame. Then verify the transform direction, units, coordinate axes, and matrix format or other representation required by the API you use. |
| VPS map diamonds are present and the GPS or WPS track remains far from them while requests do not localize | The device may be outside the mapped area. Map diamonds are available only when optional map-topology events were recorded. | Reproduce the issue inside the known mapped area. |
| Recall remains low across controlled sessions with suitable images and stable network | The captured area or VPS map may be difficult to localize against. | Compare sessions from multiple viewpoints before improving the scan with Scaniverse troubleshooting. |
Slow or intermittent localization
Localization eventually succeeds, but it is delayed, inconsistent, or unreliable across attempts. Use the following table to compare the viewer evidence with the most common causes of slow or intermittent localization.
Rows that refer to request thumbnails require frame thumbnails to have been enabled when the session was captured. See Configure VPS Debugger.
| Viewer evidence | What it may indicate | Next action |
|---|---|---|
Requests remain pending or end with BadNetworkConnection | The network is slow or unreliable. | Test with a more reliable connection and compare the timeline with a working session. |
| Request durations are consistently longer than a working session | Network or service latency is contributing to the delay. | Compare mean and median response time in VPS Map Localization Stats across sessions. |
| Failed request thumbnails show mostly ground, sky, or low-texture surfaces | The submitted images lack distinctive visual features. | Point the camera toward distinctive features and reproduce the issue. |
| Recall remains low across controlled sessions with suitable images and stable network | The captured area or VPS map may be difficult to localize against. | Compare sessions from multiple viewpoints before improving the scan with Scaniverse troubleshooting. |
Universal Localization Request Timeline shows repeated pending, failed, or FrameRejected requests across attempts | Coarse geopositioning is unstable because of network problems, missing geographic prior data, or poor input frames. The VPS2 API reports geoposition through coarse tracking regardless of whether a Universal Localization request succeeds. | Compare the Universal Localization timeline with a working session. Confirm network reliability, location permission, current GPS input, and normal device tracking. |
Wrong geographic position
Localization succeeds, but the reported geographic position still looks wrong in the app or on the map. Use the following table to compare that result against the most common geo-positioning causes.
| Viewer evidence | What it may indicate | Next action |
|---|---|---|
| Universal Localization is off in Session Info | Coarse geopositioning from universal localization is disabled for the session. | Enable Universal Localization if you need its request diagnostics or its coarse-geopositioning contribution, restart VPS2, and reproduce the issue. |
| Early geo tracks are inaccurate while universal localization requests are still pending or absent | Cloud geopositioning has not completed its initial response. | Inspect Universal Localization Request Timeline and allow time for the initial response. See Cold start. |
| The VPS2 track does not match expected ground truth after successful localization | The VPS map may not be well geo-aligned, or one or more external location sources may be inaccurate. | Compare the VPS2 track against known or expected ground truth on the map. Treat GPS, WPS, and VPS2 as evidence to investigate, not as proof of root cause or something NSDK can correct. Confirm the map alignment in Scaniverse Web. See Geo-alignment and absolute accuracy. |
Wrong anchor or content pose
Localization succeeds, but the anchor state or placed content still looks wrong in the app. Use the following table to distinguish anchor-tracking problems from content-transform problems.
| Viewer or app evidence | What it may indicate | Next action |
|---|---|---|
| Localization requests succeed, but placed content has the wrong position or orientation | Application content may be using the returned transform incorrectly. The viewer cannot validate application rendering or content transforms. | Verify the transforms the app uses to place content after localization. |
Share a diagnostic session
If you need another developer or Niantic Spatial support to investigate the issue, provide:
- The
VpsDebuggerLog_*file from the affected session. log.txtfrom the same session.- The NSDK version and application platform.
- The Site being tested and the approximate time when the issue occurred.
- The expected and observed device and anchor tracking states.
- Whether the issue is consistent or intermittent, and a working-session log when one is available.
Debugger logs can contain precise location tracks and, when frame thumbnails are enabled, images of the user’s surroundings. Review your organization’s data-handling requirements before sharing or retaining these files.